Azure Virtual Desktop - What is RTT?
Azure Virtual Desktop - What is RTT?
Let’s go!
Table of contents
- What is RTT?
- How to find the Azure region with the best RTT for your users
- What happens when the RTT is too high?
- How to optimize the RTT
- Troubleshooting
What is RTT?
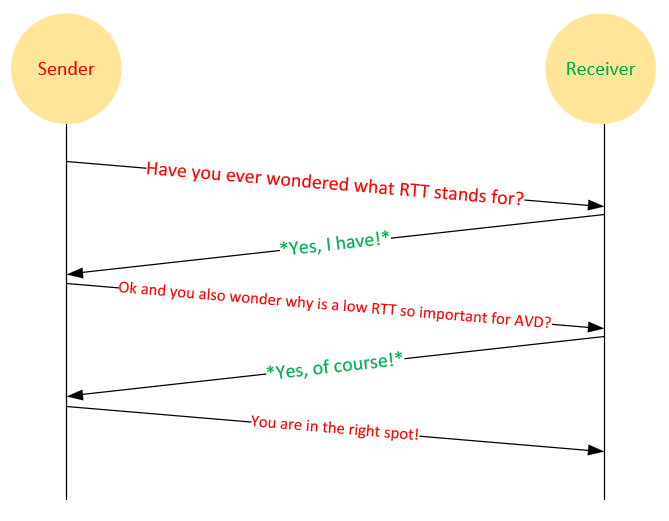
RTT means Round-Trip-Time that is the amount of time it takes for a signal to be sent plus the amount of time it takes for acknowledgement of that signal having been received. This time delay includes propagation times for the paths between the two communication endpoints. Wikipedia
Short description for RTT it is the time it takes a package to go from the sender to the recipient and back. A real life example: you send a package by mail to your friend and he sends this package back to you after acknowledgement. This described the RTT.
There are many network hops along the way that can affect processing, and each additional hop that processes the packet can increase the RTT. Another influence is the length of the distance a packet has to travel between sender and receiver, i.e. the latency required to send a request to the receiver and a response to the sender.
Also, if the network quality is unacceptable and there is a lot of packet loss, for example, connections from moving trains or WiFi hotspots with many users. These are factors that can also increase RTT.
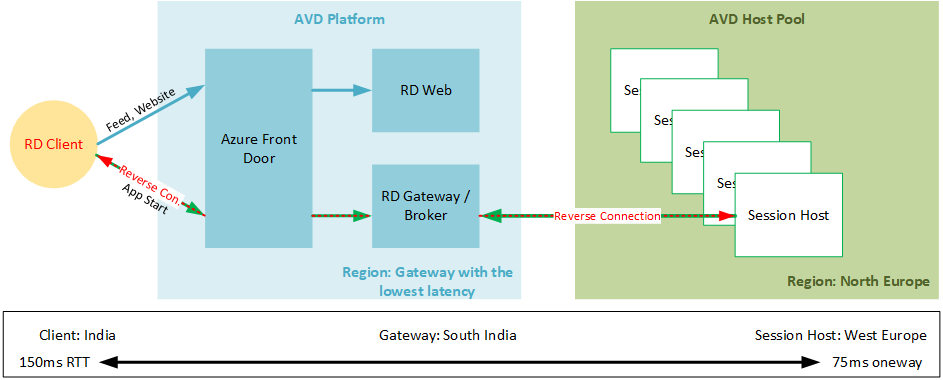
This diagram describes the connection between the Remote Desktop Client and the AVD Session Host VM.
It is intended to show an example of a client connection from Central India and an AVD Session Host located in Azure Western Europe. The RTT is imaginary and strongly varied.
How to find the Azure region with the best RTT for your users
The most important question before we can answer the other question is: where are your users?
If your users are located in India, it would make sense to deploy your AVD session hosts in India or Southeast Asia. And if they are in Europe, then you should deploy in the Azure region in Europe.
The AVD gateway is available in more than 30 regions around the world, as well as Azure regions.
Microsoft provides an Azure Virtual Desktop Experience Estimator to help you find the optimal Azure region for your AVD session host. This tool estimates the connection RTT from your current location through the Azure Virtual Desktop service to each Azure region where you can deploy virtual machines.
Here you will find the optimal Azure region for AVD: Azure Virtual Desktop Experience Estimator
If you want to get the current RDWeb region URL from your client, you can run the following PowerShell command:
Invoke-RestMethod -Uri "https://rdweb.wvd.microsoft.com/api/health" | Select-Object -ExpandProperty RegionUrl
The output shows the URL of the RDWeb region with the lowest latency for your client, e.g. https://rdweb-weu-r1.wvd.microsoft.com/.
What happens when the RTT is too high?
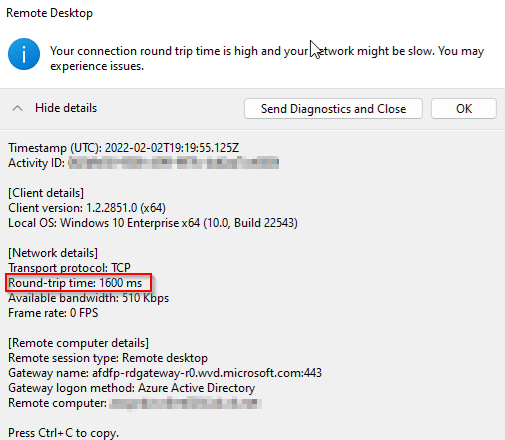
If your RTT or latency is more than 200 ms, it can affect the user experience. The effects are disconnections as well as slowness in the session, as evidenced by mouse interactions not being real-time and each interaction taking a few seconds.
Here is an extreme example with an RRT of 1600ms (1.6s), i.e. each TCP packet takes 1.6s from client to server and back. This must be avoided and it is necessary to check the network traffic flow.
What is the path for the outgoing AVD traffic? Maybe there is a web proxy involved in the connection?
Microsoft does not recommend using any type of web proxy (scanning, SSL interception, or thread protection) for AVD traffic.
Please check the proxy server guidelines for Azure Virtual Desktop.
Microsoft quotes an RTT of up to 150 ms for a stable session if the use case has nothing to do with rendering or videos. For office applications, it seems to be stable with an RTT of 150-200 ms. Find out more here.
How to optimize the RTT
The following options are currently available:
- Analyze your network traffic flow and find network components or hops that need to be upgraded or optimized.
- Follow the proxy server guidelines for AVD (see above).
- Inform your user to update the AVD client to the latest version when a notice appears. There is no option to force an upgrade. Here you can download the latest client: https://aka.ms/avdclient
Azure Virtual Desktop RDP Shortpath for public networks (preview)
Microsoft has announced the public preview of Azure Virtual Desktop RDP shortpath for public networks. This feature is gatewayless and will improve session reliability with better latency and bandwidth.
It is based on the Universal Rate Control Protocol (URCP) and uses the STUN/ICE method to establish a direct connection between the client and the session host.
Here is a very simplified diagram:
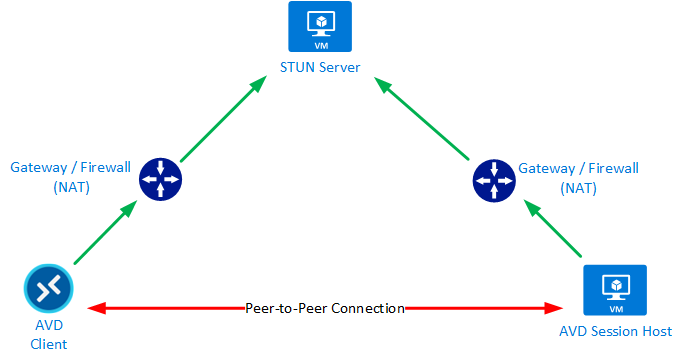
You will find the full documentation here: https://aka.ms/AVDShortPathPublic
Troubleshooting
As of February 8, 2022, there is a new option to collect and query network data for Azure Virtual Desktop connections. This can show the RTT without enabling the RemoteFX Network performance counter. I will describe both options here.
Options 1 - Collect RTT via PerfMon counters
Options 2 - Collect RTT via AVD NetworkData
Here you can find the original article from techcommunity: Collect and query Network Data for Azure Virtual Desktop connections
Prerequisites
You need to create an Azure Log Analytics workspace that can capture Windows event logs, Windows performance counters, AVD logs, and more. Log Analytics is billed according to the log data stored.
Log Analytics is required for both options.
Options 1 - Collect RTT via PerfMon counters
-
Connect your virtual machines to your Log Analytics workspace under Workspace Data Sources > Virtual machines then select a VM and connect.
-
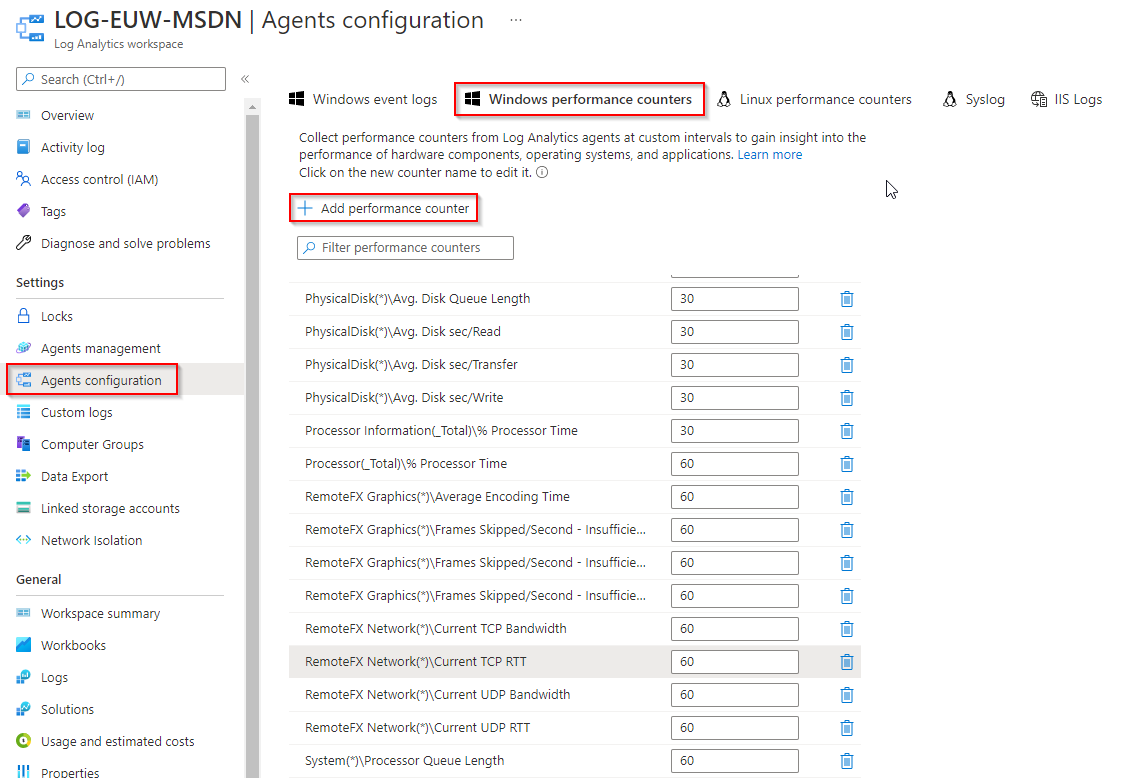
Enable the Performance Counters for RTT Network Data under Agents configuration and open the Windows performance counters tab. Then you need to add the following counters if they are not already added:
RemoteFX Network(*)\Current TCP Bandwidth
RemoteFX Network(*)\Current TCP RTT
RemoteFX Network(*)\Current UDP Bandwidth
RemoteFX Network(*)\Current UDP RTT
The bandwidth counters are not required, but can be useful to see the connection bandwidth between the client and the session host.
Options 2 - Collect RTT via AVD NetworkData
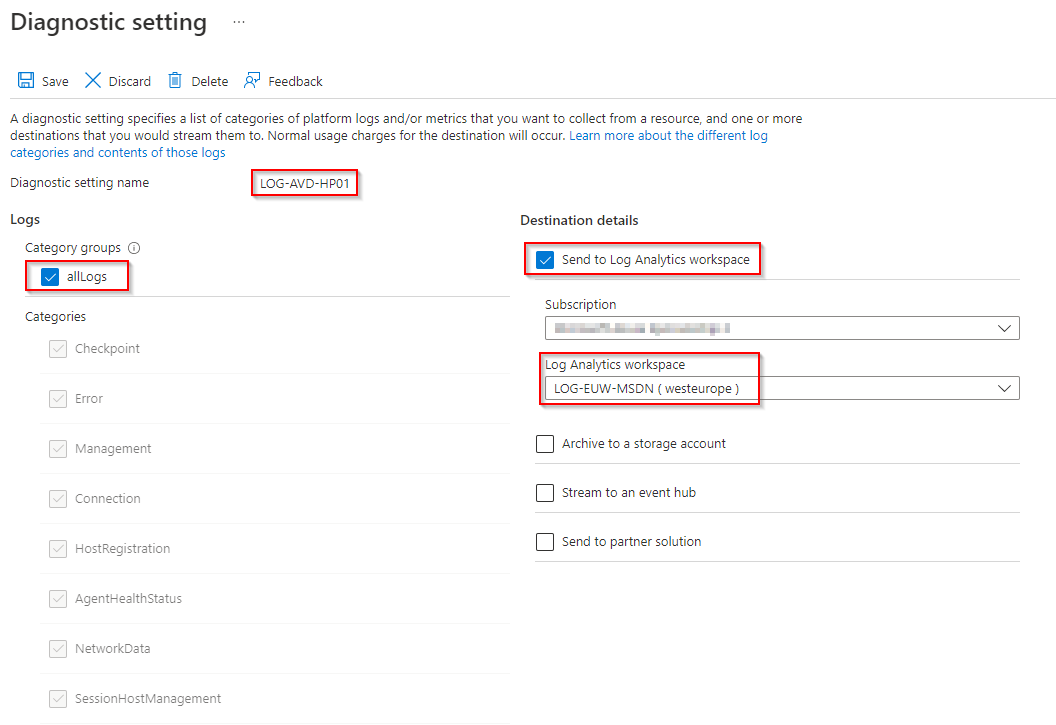
- Open the diagnostics settings for your Azure Virtual Desktop Host Pool under Monitoring > Diagnostics settings
- Add diagnostics settings and enter a setting name then select allLogs or a specific categories
Note: NetworkData is required for RTT/Bandwidth
- Activate Send to Log Analytics workspace then select your subscription and your log workspace
- Save the diagnostics setting
Note: It takes some time until the first log data is available.
Use Log Analytics to analyze the RTT
Options 1 - Collect RTT via PerfMon counters
The following KUSTO queries determine the TCP or UDP RTT average (30d) for specific AVD session host connection in the selected time frame.
Here the query for TCP RTT:
Perf
| where Computer == "server.domain.local"
| where ObjectName == "RemoteFX Network"
| where CounterName == "Current UDP RTT"
| summarize AggregatedValue = avg(CounterValue) by bin(TimeGenerated, 30d), Computer
Here the query for UDP RTT:
Perf
| where Computer == "server.domain.local"
| where ObjectName == "RemoteFX Network"
| where CounterName == "Current UDP RTT"
| summarize AggregatedValue = avg(CounterValue) by bin(TimeGenerated, 30d), Computer
Note: You can use the WVDConnections query to get the user session ID, but this SessionHostSessionId is not automatically also the ID for the RDP session instance name (rdp-sxs[StackVersion] [ID]), for example, “rdp-sxs220202160 0”.
Options 2 - Collect RTT via AVD NetworkData
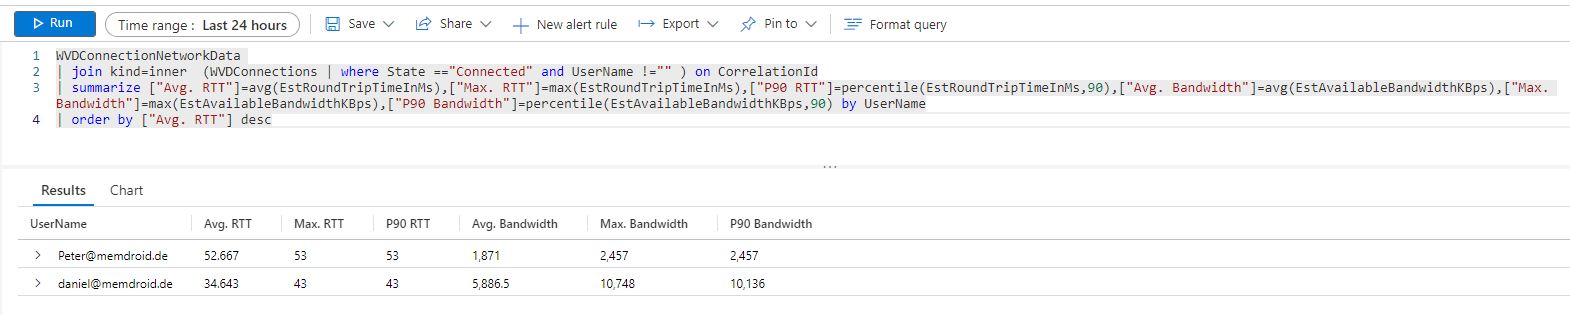
The following KUSTO query determines the average, maximum, and P90 for RTT and bandwidth for all connected user sessions in the selected time frame.
WVDConnectionNetworkData
| join kind=inner  (WVDConnections | where State =="Connected" and UserName !="" ) on CorrelationId
| summarize ["Avg. RTT"]=avg(EstRoundTripTimeInMs),["Max. RTT"]=max(EstRoundTripTimeInMs),["P90 RTT"]=percentile(EstRoundTripTimeInMs,90),["Avg. Bandwidth"]=avg(EstAvailableBandwidthKBps),["Max. Bandwidth"]=max(EstAvailableBandwidthKBps),["P90 Bandwidth"]=percentile(EstAvailableBandwidthKBps,90) by UserName
| order by ["Avg. RTT"] desc