Table of contents
- Introduction
- Understanding the Function of Azure Monitor Agent
- Enabling AVD Insight Using Azure Monitor Agent
- Provisioning AVD Session Hosts with Azure Monitor Agent via ARM Template
- Validating Azure Monitor Data for AVD Insights
- Conclusion
Introduction
The current AVD Insights are based on Azure Log Analytics workspaces that use multiple agents such as Monitoring Dependency Agent or Microsoft Monitoring Agent (MMA) to collect monitoring data from session hosts.
AVD Insights visualizes these AVD platform log entries, session hosts event logs and performance data in charts and tables. The idea behind it is to improve troubleshooting to solve problems faster and get a complete overview of the entire AVD environment. You can also create some report exports to discuss usage with the management level.
Two years ago, on 19 August 2021, we announced we were retiring the Log Analytics Agent (MMA & Co) to simplify everything to one agent, the Azure Monitor Agent (AMA). Because of this, we need to move all virtual machines to Azure Monitor Agent by 31 August 2024, which includes Azure Virtual Desktop Session Hosts and AVD Insights.
Here is the official announcement:
“On 31 August 2024, we’ll retire the Log Analytics agent that you use in Azure Monitor. Before that date, you’ll need to start using the Azure Monitor agent to monitor your VMs and servers in Azure.”
With only one monitoring agent, we want to eliminate confusion about which agent is responsible for which mission.
This change also affects AVD insights, and we need to migrate existing AVD session hosts to use the Azure Monitor agent, and new session hosts we should enable to use the new agent directly.
This blog post does not describe how to migrate from the legacy agent to the Azure Monitor agent, but how to enable AVD Insight with AMA. Please follow the migrate guide.
Here is the official GA announcement for AVD Insights powered by Azure Monitor Agent.
Understanding the Function of Azure Monitor Agent
Azure Monitor Agent serves as a bridge between AVD deployments and Azure Monitor, enabling administrators to gain real-time insights into the performance and health of their virtual desktop environments. By collecting essential telemetry data from AVD infrastructure and session hosts, the agent facilitates informed decision-making, proactive issue resolution, and overall optimization.
Azure Monitor Agent uses data collection rules that allow you to specify the specific data you want each agent to collect. These rules allow you to comprehensively manage data collection settings and create different, customized configurations for specific groups of machines. It is possible to specify rules that route data from numerous machines to multiple destinations across regions and tenants.
The following diagram shows the AVD Insights with Azure Monitor:
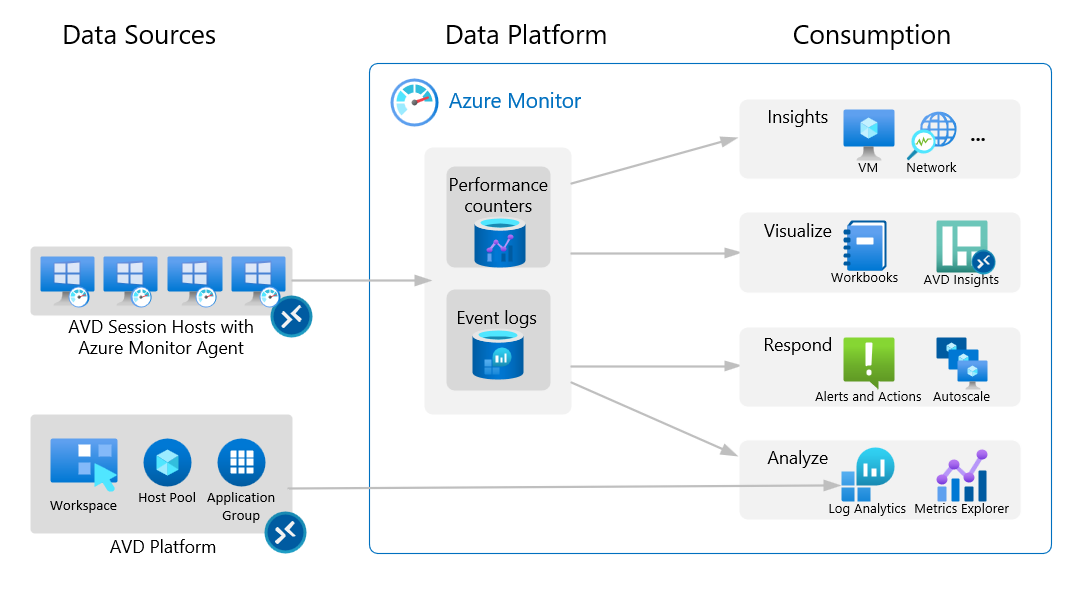
Related to AVD, Windows event logs, such as FSLogix logs, are captured from session hosts along with performance counters such as processor information, memory, or terminal services. Additionally, some information comes from the AVD platform itself, e.g. AVD Errors or NetworkData logs, which are sent to the Log Analytics Workspace.
If you want to understand the differences between Azure Monitor Agent and Legacy Agents, please follow this link: Compare to legacy agents
For more information about the AMA, please visit here.
Enabling AVD Insights Using Azure Monitor Agent
Requirements
AVD Insights with Azure Monitor Agent has the same requirements as the previous version of AVD Insight, which means you need a Log Analytics Workspace to collect all log entries and performance counters.
You can use the following PowerShell commands to create a new Log Analytics workspace:
$ResourceGroupName = "YourResourceGroupName"
$LogWorkspaceName  = "YourLogAnalyticsWorkspaceName"
$Location = "YourRegion"
New-AzOperationalInsightsWorkspace -Location $Location -Name $LogWorkspaceName  -ResourceGroupName $ResourceGroupName
Otherwise, you can follow the Microsoft documentation to create Log Analytics workspace in the Azure Portal.
Another requirement to be met is enabling managed identity on Azure virtual machines. This includes support for both user- and system-assigned managed identities.
For machines joined only to Microsoft Entra ID, the system-managed identity is enabled automatically, but for hybrid machines, the synchronization process and the connection process to Microsoft Entra ID must be performed successfully.
For more information, please visit the following link.
How to enable AVD Insight
Via Azure Portal
- Open Azure Virtual Desktop Blade (https://azavd.cmd.ms/) and navigate to Host Pools and select the host pool you want to enable for AVD Insights with Azure Monior Agent.
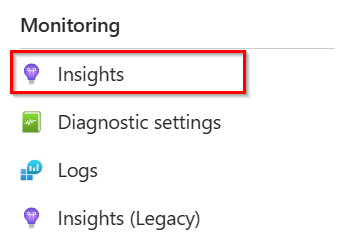
- Under Monitoring, select Insights, which normally opens the AVD Insights, but if it is not yet configured, it shows that the configuration workbook is opened.
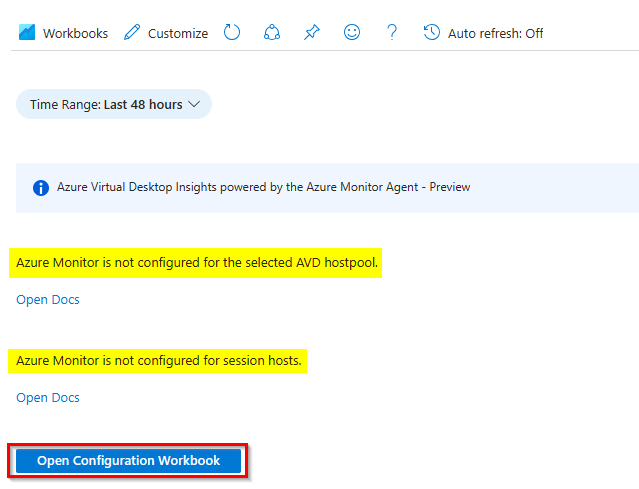
- Next, you will see that Azure Monitor is not configured and click Open Configuration Workbook to start the configuration.
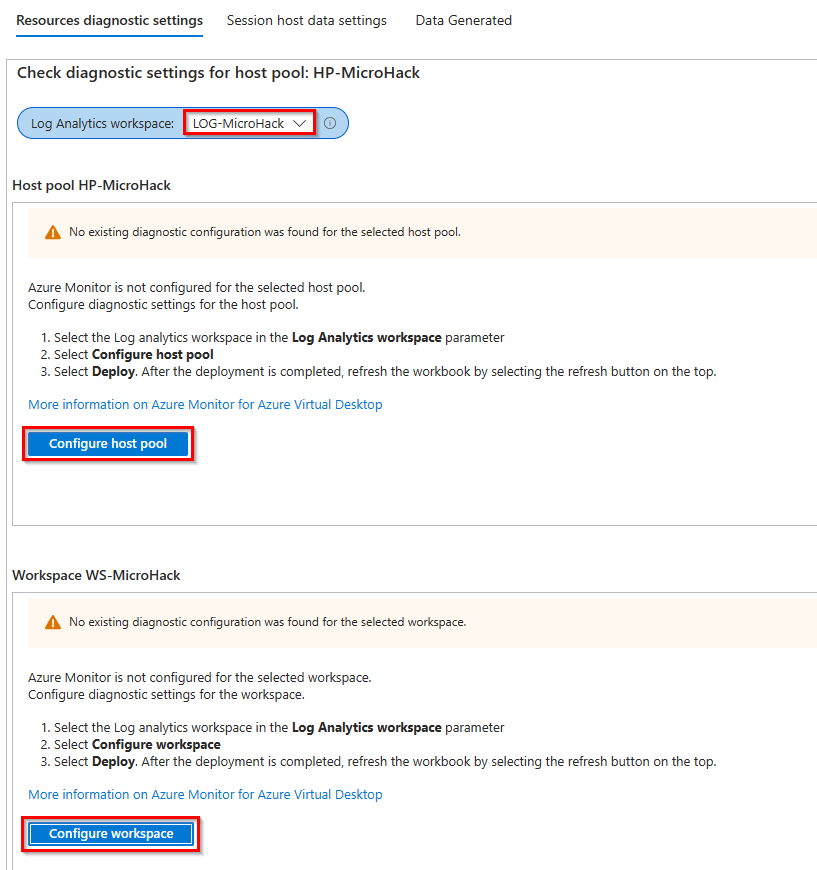
- On the Resources diagnostics Settings tab, select your Log Analytics workspace where you want to store all logs.
Note: When setting the Log Analytics workspace, it may be helpful to click Refresh in the workbook.
After that, you need to configure the host pool and workspace to send the log from the AVD platform to your Log Analytics workspace. These configuration steps are quite simple and are the same as in the old version of AVD Insights. The diagnostic settings are provided in your Host Pool and Workspace, which configures the destination for all data.
- Switch to the Session Host Data Settings tab and the next steps are now new.

- First, we need to create a data collection rule in an existing resource group.
Select your Log Analytics Workspace and DCR resource group, then click Create data collection rule. This deployment creates an Azure Monitor data collection rule that contains the configuration to collect all required monitoring data from the session hosts.

- When the data collection rule is available, next you need to select this DCR rule microsoft-avdi-westeurope.

The next steps are simple, as the Azure Monitor Agent must be installed on all session hosts and the session hosts must be associated with the data collection rule. So that the session hosts know what monitoring data they need to send to the log analysis workspace.
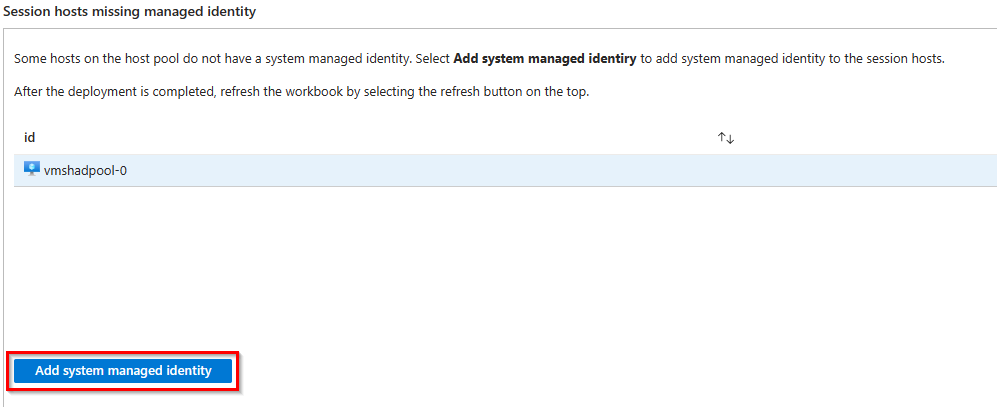
- First, check that all session hosts have a system-managed identity. If not, you can add it here (Add system managed identity) to all session hosts that lack it.
- Second, click Deploy Association to bind all session hosts to the data collection rule.

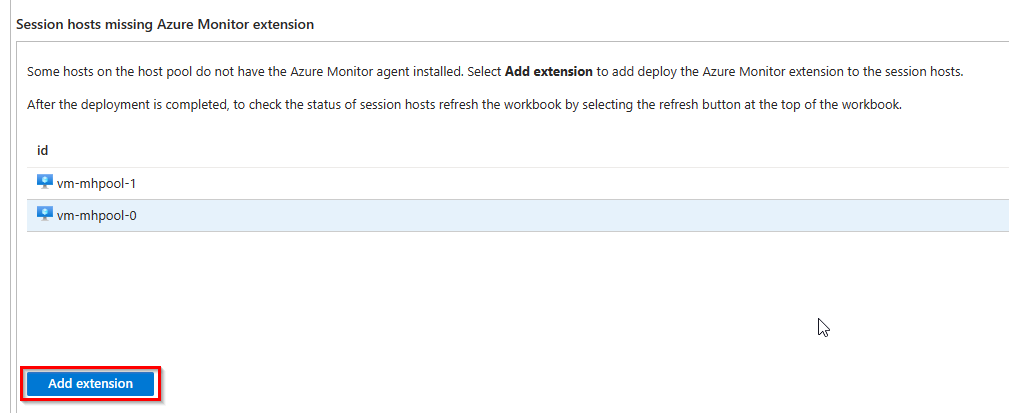
- Last, you have to install the Azure Monitor Agent to all session hosts with Add extension.
To verify Data Collection Rule association for the AVD session hosts, open the data collection rule and select Resources:
.ResourceId
# Enable AVDInsights (Diagnostic Settings) for the AVD Host Pool
$log = @()
$log += New-AzDiagnosticSettingLogSettingsObject -Enabled $true -CategoryGroup allLogs
New-AzDiagnosticSetting -Name "AVDInsights" -ResourceId (Get-AzWvdHostPool -Name $HostPoolName -ResourceGroupName $ResourceGroupName).Id -WorkspaceId $LogWorkspaceId -Log $log -Verbose
# Enable AVDInsights (Diagnostic Settings) for the AVD Workspace
$log = @()
$log += New-AzDiagnosticSettingLogSettingsObject -Enabled $true -CategoryGroup allLogs
New-AzDiagnosticSetting -Name "AVDInsights" -ResourceId (Get-AzWvdWorkspace -Name $WorkspaceName -ResourceGroupName $ResourceGroupName).Id -WorkspaceId $LogWorkspaceId -Log $log -Verbose
# Create new the AVDInsight Azure Monitor Resource Group
New-AzResourceGroup -Name "YourDCR-ResourceGroup" -Location $Location
# Replace the WorkspaceId placeholder with the correct Log Analytics WorkspaceId.
# See DCR-Template.json below.
$DCRTemplate = (Get-Content ".\DCR-Template.json").Replace("<WORKSPACE>",$LogWorkspaceId) | Set-Content ".\DCR-Template-$WorkspaceName.json"
# Import the DataCollectionRule for AVD Insights from JSON Template
New-AzDataCollectionRule -Location $Location -ResourceGroupName "YourDCR-ResourceGroup" -RuleName "microsoft-avdi-$Location" -RuleFile ".\DCR-Template-$WorkspaceName.json"Note: The DataCollectionRule must be named as microsoft-avdi-“AzureRegion”, e.g. “microsoft-avdi-westeurope”. This is required by the workbook and cannot be changed.
This is the DCR-Template.json file (Status: 31 August 2023) needed to create the AVDInsight DataCollectionRule with the above commands:
{
"properties": {
                "dataSources": {
                    "performanceCounters": [
                        {
                            "streams": [
                                "Microsoft-Perf"
                            ],
                            "samplingFrequencyInSeconds": 30,
                            "counterSpecifiers": [
                                "\\LogicalDisk(C:)\\Avg. Disk Queue Length",
                                "\\LogicalDisk(C:)\\Current Disk Queue Length",
                                "\\Memory\\Available Mbytes",
                                "\\Memory\\Page Faults/sec",
                                "\\Memory\\Pages/sec",
                                "\\Memory\\% Committed Bytes In Use",
                                "\\PhysicalDisk(*)\\Avg. Disk Queue Length",
                                "\\PhysicalDisk(*)\\Avg. Disk sec/Read",
                                "\\PhysicalDisk(*)\\Avg. Disk sec/Transfer",
                                "\\PhysicalDisk(*)\\Avg. Disk sec/Write",
                                "\\Processor Information(_Total)\\% Processor Time",
                                "\\User Input Delay per Process(*)\\Max Input Delay",
                                "\\User Input Delay per Session(*)\\Max Input Delay",
                                "\\RemoteFX Network(*)\\Current TCP RTT",
                                "\\RemoteFX Network(*)\\Current UDP Bandwidth"
                            ],
                            "name": "perfCounterDataSource10"
                        },
                        {
                            "streams": [
                                "Microsoft-Perf"
                            ],
                            "samplingFrequencyInSeconds": 60,
                            "counterSpecifiers": [
                                "\\LogicalDisk(C:)\\% Free Space",
                                "\\LogicalDisk(C:)\\Avg. Disk sec/Transfer",
                                "\\Terminal Services(*)\\Active Sessions",
                                "\\Terminal Services(*)\\Inactive Sessions",
                                "\\Terminal Services(*)\\Total Sessions"
                            ],
                            "name": "perfCounterDataSource30"
                        }
                    ],
                    "windowsEventLogs": [
                        {
                            "streams": [
                                "Microsoft-Event"
                            ],
                            "xPathQueries": [
                                "Microsoft-Windows-TerminalServices-RemoteConnectionManager/Admin!*[System[(Level=2 or Level=3 or Level=4 or Level=0)]]",
                                "Microsoft-Windows-TerminalServices-LocalSessionManager/Operational!*[System[(Level=2 or Level=3 or Level=4 or Level=0)]]",
                                "System!*",
                                "Microsoft-FSLogix-Apps/Operational!*[System[(Level=2 or Level=3 or Level=4 or Level=0)]]",
                                "Application!*[System[(Level=2 or Level=3)]]",
                                "Microsoft-FSLogix-Apps/Admin!*[System[(Level=2 or Level=3 or Level=4 or Level=0)]]"
                            ],
                            "name": "eventLogsDataSource"
                        }
                    ]
                },
                "destinations": {
                    "logAnalytics": [
                        {
                            "workspaceResourceId": "<WORKSPACE>",
                            "name": "la-workspace"
                        }
                    ]
                },
                "dataFlows": [
                    {
                        "streams": [
                            "Microsoft-Perf",
                            "Microsoft-Event"
                        ],
                        "destinations": [
                            "la-workspace"
                        ]
                    }
                ]
            }
}
Note: You need to add your specific Log Analytics Workspace Id and name to the JSON template.
If you want to check which session hosts are associated with the DataCollectionRule, you can run the following PowerShell command:
$Location = "YourRegion"
(Get-AzDataCollectionRuleAssociation -ResourceGroupName "AzureMonitor-DataCollectionRules" -RuleName "microsoft-avdi-$Location").Id
Provisioning AVD Session Hosts with Azure Monitor Agent via ARM Template
After successfully enabling AVD Insights for your host pools, session hosts are required to collect monitoring data. There are several ways to enable Azure Monitor Agent on virtual machines, such as a post-installation or via a global Azure policy, but I would like to show the option to provision new session hosts via an ARM template/deployment that installs Azure Monitor Agent and associates the session hosts directly with the data collection rule.
Use the following PowerShell commands to obtain the Data Collection Rule Id required for the association:
$dataCollectionRuleId = (Get-AzDataCollectionRule -ResourceGroupName "AzureMonitor-DataCollectionRules" -RuleName "microsoft-avdi-westeurope").IdFirst of all, this is not the full template for deploying an AVD session host, but the part about installing and linking the Azure Monitor Agent. The idea is to integrate this part into your own existing ARM template.
Once you have found out the Resource Id of the data collection rule, add this value to the parameter file or parameter set and then you can perform the ARM deployment.
{
    "$schema": "https://schema.management.azure.com/schemas/2019-04-01/deploymentTemplate.json#",
    "contentVersion": "6.0.0.0",
    "parameters": {
        "rdshNamePrefix": {
            "type": "string",
            "metadata": {
                "description": "This prefix will be use for the AVD session hosts."
            },
            "defaultValue": ""
        },
        "vmNumber": {
            "type": "string",
            "metadata": {
                "description": "The VM number to be provisioned"
            }
        },
        "location": {
            "type": "string",
            "defaultValue": "[resourceGroup().location]",
            "metadata": {
                "description": "(Required for Azure Marketplace.) Leave as is, unless you would like to not use a location that is different from the location of the resouce group."
            }
        },
        "dataCollectionRuleId": {
            "type": "String",
            "metadata": {
                "description": "Azure Monitor Agent - Data Collection Rule Resource Id."
            },
            "defaultValue": ""
        },
        "monitoring": {
            "type": "bool",
            "metadata": {
                "description": "Do you want to install the monitoring agent?"
            },
            "defaultValue": false
        }
    },
    "resources": [
        {
            "condition": "[parameters('monitoring')]",
            "type": "Microsoft.Compute/virtualMachines/extensions",
            "apiVersion": "2021-11-01",
            "name": "[concat(parameters('rdshNamePrefix'), parameters('vmNumber'), '/', 'AzureMonitorWindowsAgent')]",
            "location": "[parameters('location')]",
            "properties": {
                "publisher": "Microsoft.Azure.Monitor",
                "type": "AzureMonitorWindowsAgent",
                "typeHandlerVersion": "1.0",
                "autoUpgradeMinorVersion": true,
                "enableAutomaticUpgrade": true
            }
        },
        {
            "condition": "[parameters('monitoring')]",
            "type": "Microsoft.Insights/dataCollectionRuleAssociations",
            "apiVersion": "2021-09-01-preview",
            "name": "AzureMonitorDataCollectionRuleAssociations",
            "scope": "[format('Microsoft.Compute/virtualMachines/{0}', concat(parameters('rdshNamePrefix'), parameters('vmNumber')))]",
            "properties": {
                "description": "Association of data collection rule. Deleting this association will break the data collection for this virtual machine.",
                "dataCollectionRuleId": "[parameters('dataCollectionRuleId')]"
            }
        }
    ]
}
If the ARM deployment was successful, the Azure Monitor Agent should be installed and linked directly to the AVD Insight data collection rule.
You will find more information about the Data Collection Rule association via ARM template here.
Validating Azure Monitor Data for AVD Insights
Now you have configured everything, enabled AVD Insight, installed Azure Monitor Agent on all your session hosts and linked them to the AVD Insight data collection rule.
To verify that the Azure Monitor data is now saved, open the AVD Insight configuration workbook again and scroll down to find the link for the configuration workbook.

Then open the Generated Data tab and select your information (Subscription, Resource Group, and Host Pool). Then you can see if any data has been generated and stored in the Log Analytics workspace.

Conclusion
In summary, I recommend enabling AVD Insight from a troubleshooting perspective to learn more about our entire AVD environment, if everything is working as expected or if you need to change VM sizes due to performance issues. With AVD Insights, you can see much more, such as round-trip time & bandwidth in graphs or time to connect for each user.
Due to the retirement of legacy monitoring agents in August 2024, you should plan to migrate all your existing AVD session hosts to Azure Monitor Agent as soon as possible, and otherwise, when you create new AVD host pools, deploy the new Azure Monitor Agent directly.
One agent less and so much more! 😉
Last but not least: Please send us feedback if you found any bugs or have ideas for AVD Insights.
Resources
Learn more about Insights Glossary
Learn more about AVD Insight
